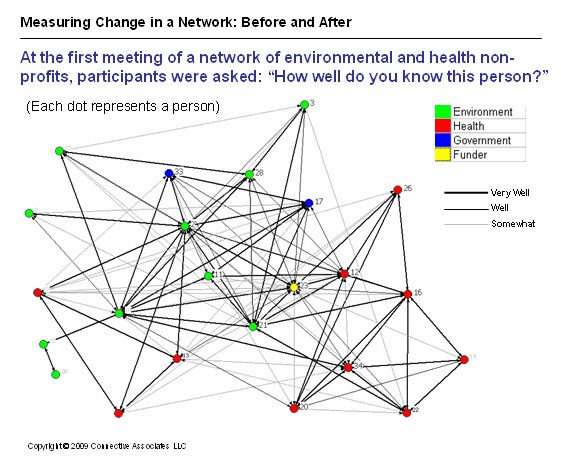
We helped to assess and facilitate a network of about ten non-profits from the environmental and health fields and representatives of the City of Boston. The network was convened by the Barr Foundation who saw potential for the participants to work together to promote green and healthy buildings in Boston, since their goals were similar and overlapped. A Social Network Analysis (SNA) was conducted at the first meeting of the new network and showed that the connections amongst participants were limited, particularly between the environmental and health non-profits. Here is the original map:

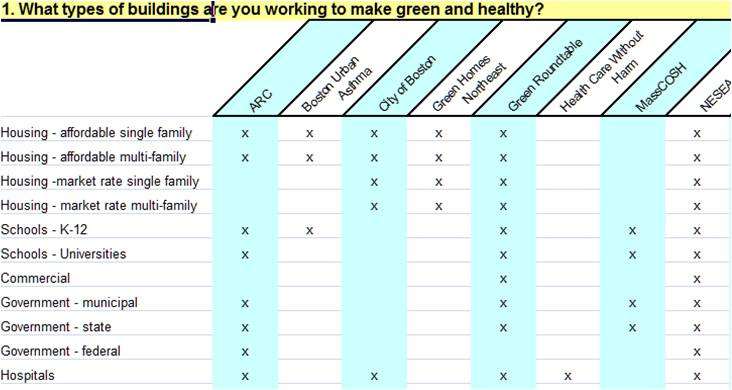
We developed a survey that inventoried the type of audiences and strategies each non-profit was pursuing. This data was displayed in a matrix that enabled each participant to see who was working on what and where there were areas of duplication and gaps. For example, here is one part of the matrix that showed many groups were working on housing:

This matrix enabled people to see the whole system and it served as the basis for conversations about how the network members could better align their work and focus in on which areas would be most valuable to collaborate on. We facilitated regular meetings on the network for two years.
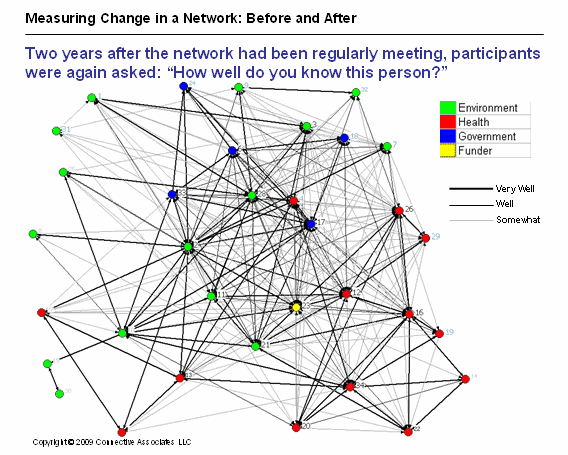
In a survey conducted about two years after the network began meeting, 95 percent of the participants agreed that the network had helped their organization advance its mission. A second SNA showed that the levels of regular communication and collaboration among network members had multiplied. The Network’s key accomplishments fell into four areas:
- Enhanced connectivity among the Network participants that led to new relationships, expanded knowledge, and greater awareness of each others’ work.
- Greater alignment and coordination of advocacy work by the non-profit organizations and enhanced access to decision-makers
- The integration of green and healthy building objectives in tangible projects by the City of Boston and within the work of participating non-profit organizations
- New collaborations among Network organizations that led to significant gains in promoting green and healthy buildings.
Here is what the network map looked like after the network had been meeting for two years – note the density of relationships between environmental and health non-profits (green and red dots) and how many more people had relationships with city government contacts (blue dots):

Click here to download a case study about how the network was formed, operated, and the results it achieved, including the maps from the social network analysis.
