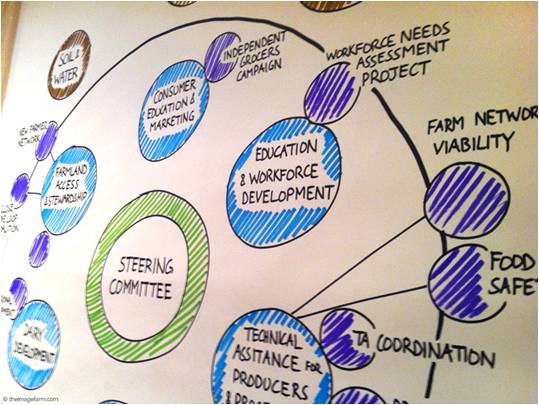
When people are coming together in a network to work on changing a system, such as local food, they need a picture of the system as a whole and its parts. Pictures are also helpful to map how work gets done in a network – and these images look much more molecular and circular than a traditional hierarchical organizations. In several recent client projects, we have found great value in creating graphics that help people “see the system.” This includes developing visuals of the system people are working to change, e.g., the food system, as well as creating simple pictures of the network structure. The goal is to help people see how their work fits into a larger system.
At the Vermont Farm to Plate Network Gathering, we had the pleasure of working with Matt Heywood of The Image Farm, a graphic illustrator, who created large images that graced the walls and provided a shared reference for the two days of conversations. The images Matt created for Vermont Farm to Plate Network included a map of the food system (with cross-cutting issues as slices of bread,) a picture of the network structure, and a time line of the history of the network that people could add on to during the gathering. Click on the images below for a slide show version.
